

China has been the world’s largest outbound tourism market by spending for more than a decade, and after the 2023 border reopening it has recovered faster than almost anyone expected. But the headline numbers are easy to misread: government agencies, immigration records, balance-of-payments data and private forecasters all publish different “China outbound” figures, and none of them means quite the same thing as another. This guide lays out the verified China outbound tourism statistics for 2027, explains how each figure is actually measured, and shows where the market has genuinely recovered versus where it has quietly transformed.
1. Key Statistics at a Glance
Below is a concise summary of verified China outbound tourism statistics. Different agencies use different statistical definitions, so figures are kept separate and clearly labeled by source and data status. See Section 2 for a detailed explanation of these definitions.
| Period | Statistic | Figure | YoY | Source | Data Status | Definition / Caveat |
|---|---|---|---|---|---|---|
| 2019 | Outbound visits (mainland residents) | 169.21 million | +4.5% | NBS Statistical Communiqué 2019 | Official actual | Baseline pre-pandemic year; includes HK, Macau, Taiwan |
| 2024 | Outbound visits (mainland residents) | 145.89 million | +41.0% | NBS Statistical Communiqué 2024 | Official actual | Same NBS series as 2019; includes 97.12M HK/Macau/Taiwan visits |
| 2025 | Outbound tourism trips | 148.36 million | +20.8% | MCT 2025 Statistical Bulletin | Official actual | MCT tourism-trip definition; NOT directly comparable to NBS visits |
| 2025 | Outbound visits (mainland residents) | 167.92 million | +15.1% | NBS Statistical Communiqué 2025 | Official actual | Same NBS series as 2024; includes 112.71M HK/Macau/Taiwan |
| H1 2026 | Outbound border crossings | 88.023 million | +10.5% | NIA, Oct 2026 release | Official actual (partial year) | Mainland resident exit crossings; different from tourism trips |
| Q3 2026 | Outbound border crossings | 48.508 million | +7.5% | NIA, Oct 20, 2026 release | Official actual (quarterly) | July-September 2026 exit crossings |
| 2026 (full year) | Outbound trips (forecast) | ~179.3 million | N/A (forecast) | China Trading Desk, Aug 19 2026 | Industry forecast | CTD model estimate; not comparable to MCT official trips |
| 2026 (full year) | Destination spending (forecast) | US$257.6 billion | N/A (forecast) | China Trading Desk, Aug 19 2026 | Industry forecast | Destination-spending estimate; not a BOP measure |
| 2025 | Travel service imports (BOP) | US$253.78 billion | +1.1% | SAFE data (Xinhua-reported) | Official actual (BOP) | BOP travel debit; excludes international air fares (those are in transport services). Broader than tourist spending. |
Important: Do not compare MCT tourism trips directly with NBS outbound visits or NIA border crossings. These are different statistical concepts. Growth rates should only be calculated within the same statistical series. See Section 2 for definitions.
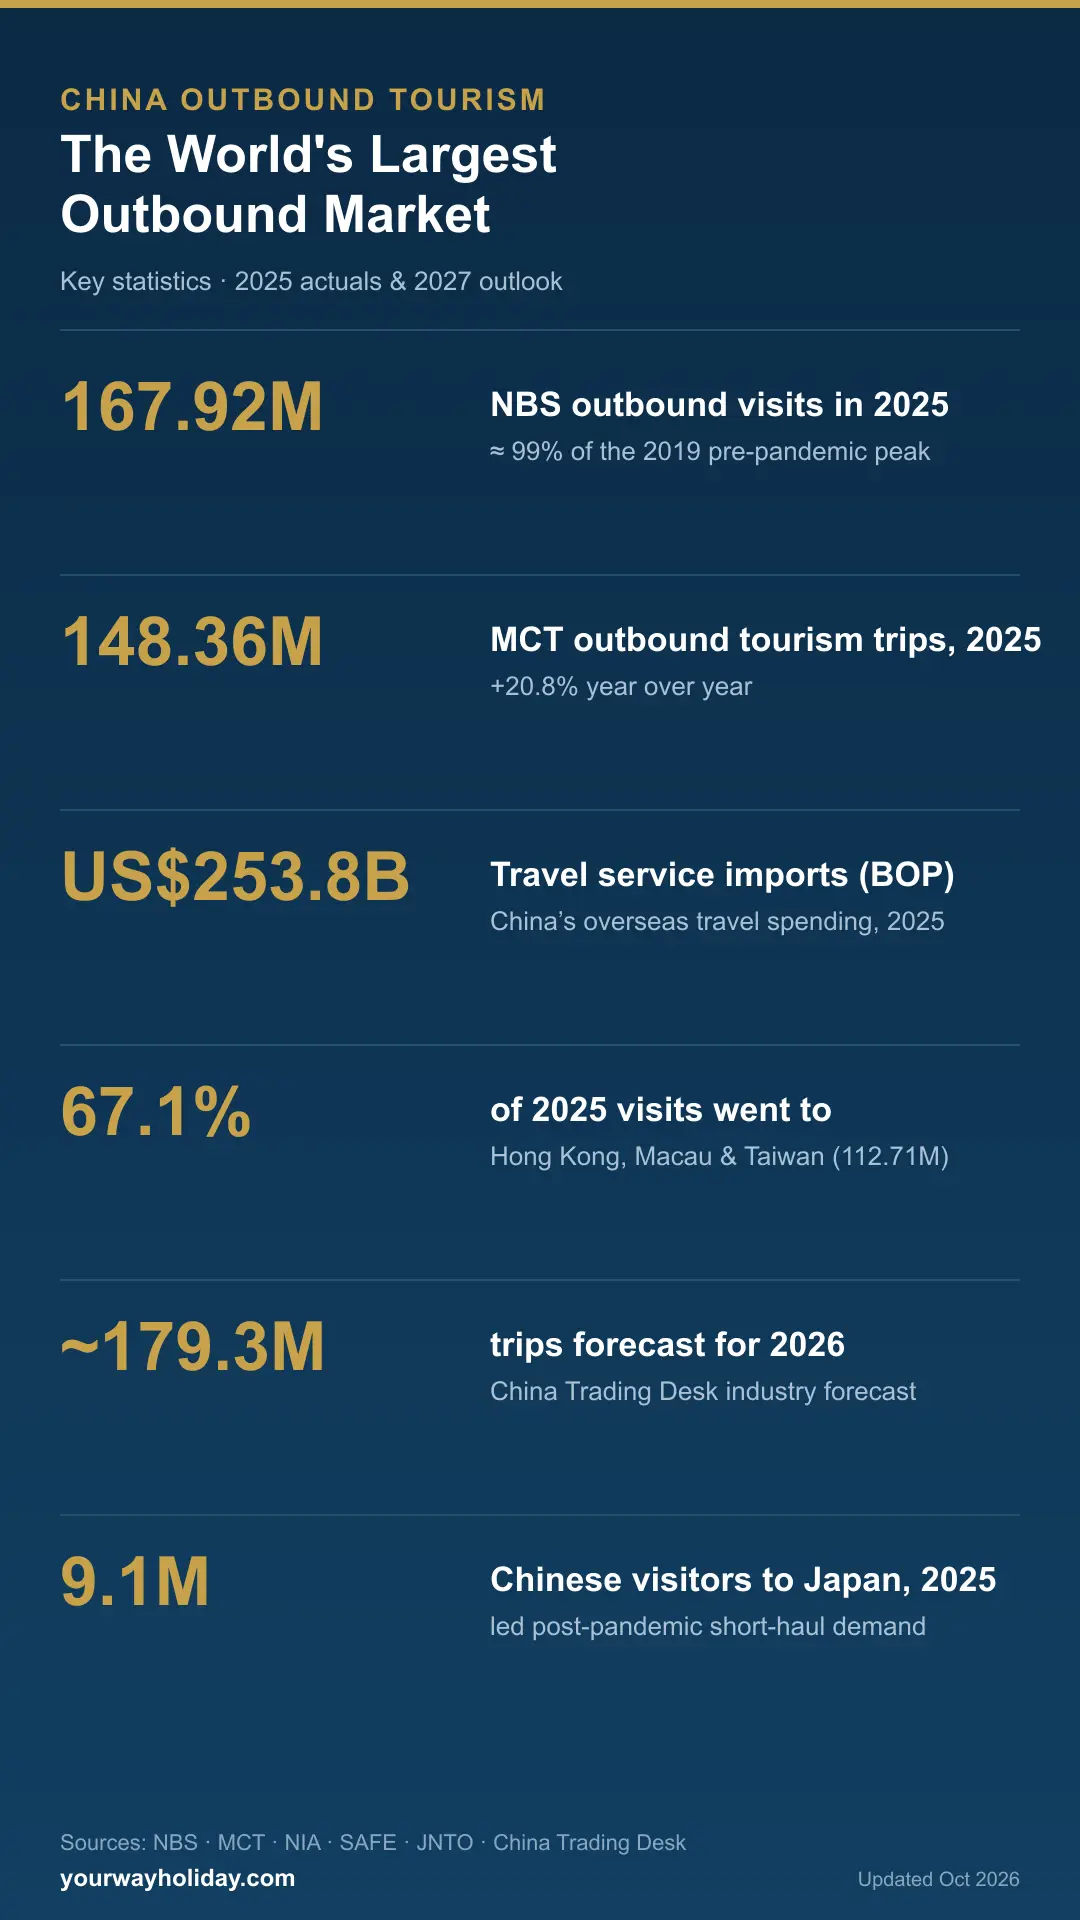
China Outbound Tourism at a Glance — save this infographic to your Pinterest board (free to reuse with attribution and a link back).
2. Understanding the Data: Definitions and Sources
China's outbound travel figures are published by multiple agencies using different measurement concepts. This is the most common source of confusion when interpreting Chinese outbound tourism data. This section explains the key definitions and why numbers differ across sources. Subsequent sections will briefly cross-reference this explanation rather than repeating it in full.
2.1 Key Statistical Concepts
| Term | Primary Source | Definition | Key Distinction |
|---|---|---|---|
| Outbound tourism trips | Ministry of Culture and Tourism (MCT) | Number of outbound tourism trips made by mainland Chinese residents, measured using MCT's tourism statistical framework | Specifically tourism; counts trips not people. Uses tourism survey methodology combined with border data. |
| Outbound visits | National Bureau of Statistics (NBS) | Number of outbound visits by mainland residents, including all visits to Hong Kong, Macau, and Taiwan | Broader than "tourism trips." The 2025 NBS figure of 167.92M includes 112.71M visits to HK/Macau/Taiwan. |
| Border-crossing records | National Immigration Administration (NIA) | Administrative count of each border exit by a mainland resident | Counts each exit event. A traveler crossing multiple borders on one trip is counted multiple times. Not the same as tourism trips. |
| Travel service imports (BOP) | State Administration of Foreign Exchange (SAFE) | Travel services debit in China's balance of payments | Broadest spending measure. Includes tourism, business travel, education, medical, and payments to foreign travel providers. Not the same as "tourist spending." |
| Destination spending | Industry estimates (e.g., CTD) | Estimated spending by Chinese travelers at their destinations | Industry forecast or estimate. Methodology varies by researcher. Not directly comparable to BOP travel imports. |
| Industry forecasts | Research firms, consultancies | Projected future trip volume or spending | Forward-looking estimates based on models, booking data, or economic assumptions. Not confirmed results. |
2.2 Why MCT and NBS Figures Differ
Both MCT and NBS publish outbound travel figures, but they use different statistical definitions and methodologies. The MCT's "outbound tourism trips" (148.36 million in 2025, per MCT 2025 Statistical Bulletin) is a tourism-specific measure based on the MCT tourism statistical system. The NBS's "outbound visits" (167.92 million in 2025, per NBS 2025 Statistical Communiqué) is a broader count of all outbound visits by mainland residents.
The statistical definitions and coverage differ between the two agencies. The exact components of the difference are not fully detailed in publicly available official documentation, and readers should not assume the gap consists of any specific category of travel.
MCT tourism trips and NBS outbound visits are not two competing estimates of the same thing. They measure different concepts. Do not calculate growth rates by mixing MCT and NBS data across years.
Source: MCT: zwgk.mct.gov.cn/zfxxgkml/tjxx/202606/t20260602_966073.html | NBS 2025: www.stats.gov.cn/english/PressRelease/202602/t20260228_1962661.html | NBS 2024: www.stats.gov.cn/english/PressRelease/202502/t20250228_1958822.html
2.3 NIA Border Crossings vs. Annual Tourism Trips
NIA publishes quarterly and holiday-period border-crossing data. The 88.023 million H1 2026 figure and 48.508 million Q3 2026 figure are counts of exit border crossings by mainland residents (Source: NIA, October 2026 releases, en.nia.gov.cn).
These differ from annual tourism trip counts because: (1) each border exit is counted separately — a multi-country trip can involve multiple crossings; (2) not all border crossings are for tourism purposes; (3) NIA data is published more frequently and is useful for tracking trends, but does not directly equate to MCT or NBS annual totals.
2.4 Industry Estimates and Forecasts
Industry research firms also publish China outbound travel figures and forecasts. For example, China Trading Desk published an updated 2026 forecast on August 19, 2026, projecting approximately 179.3 million outbound trips and US$257.6 billion in destination spending (Source: China Trading Desk, "China Outbound Travel Set for Record Trip Volume in 2026," www.chinatradingdesk.com/post/china-outbound-travel-set-for-record-trip-volume-in-2026).
These are industry estimates and forecasts, not official government statistics. Their methodology may differ from official data series. The CTD "outbound trips" figure is based on the firm's own estimation model and should not be treated as directly comparable to MCT's official "outbound tourism trips."
3. Market Overview
China has been the world's largest outbound tourism market by spending for well over a decade. Following the border reopening in January 2023, the market has recovered rapidly. By 2025, NBS outbound visits reached 167.92 million — close to the 2019 level of 169.21 million (both from the same NBS statistical series).
Source: NBS 2025 Statistical Communiqué: www.stats.gov.cn/english/PressRelease/202602/t20260228_1962661.html | NBS 2019 baseline from NBS 2019 Statistical Communiqué
3.1 Recovery Phases
| Phase | Period | Description | Key Milestones |
|---|---|---|---|
| Reopening | Jan 2023 – Q1 2024 | Border reopening; pent-up demand; gradual flight restoration | Group tours resumed Aug 2023; rapid YoY growth from low base |
| Rapid growth | Q2 2024 – Q4 2025 | Strong double-digit growth as flight capacity and visa-free access expanded | 2024 NBS outbound visits: 145.89M (+41% YoY); 2025 MCT tourism trips: 148.36M (+20.8%) |
| Normalization | 2026 onward | Growth moderates as market approaches pre-pandemic levels | H1 2026 NIA outbound crossings: 88.023M (+10.5% YoY); Q3 2026: 48.508M (+7.5%) |
Source: MCT 2025: zwgk.mct.gov.cn/zfxxgkml/tjxx/202606/t20260602_966073.html | NIA Q3 2026: October 20, 2026 release, en.nia.gov.cn
By 2026, China's outbound travel market is entering a more mature growth phase. The rapid post-reopening rebound is complete. Future growth will depend on structural drivers such as rising household income in lower-tier cities, expanding visa-free access, and the normalization of long-haul flight capacity.
4. Outbound Travel Volume
4.1 NBS Outbound Visits (Comparable Series)
The NBS publishes a consistent annual series of outbound visits by mainland residents. This is the most reliable series for comparing year-over-year levels because it uses the same statistical definition across years:
| Year | Outbound Visits (Mainland Residents) | YoY Growth | HK/Macau/Taiwan Component | Source |
|---|---|---|---|---|
| 2019 | 169.21 million | +4.5% | Included (majority of visits) | NBS 2019 Statistical Communiqué |
| 2024 | 145.89 million | +41.0% | 97.12 million | NBS 2024 Statistical Communiqué |
| 2025 | 167.92 million | +15.1% | 112.71 million | NBS 2025 Statistical Communiqué |
Source: NBS 2024: www.stats.gov.cn/english/PressRelease/202502/t20250228_1958822.html | NBS 2025: www.stats.gov.cn/english/PressRelease/202602/t20260228_1962661.html | 2019 figure from NBS 2019 Statistical Communiqué (same series)
Note: 2020-2023 data are not included in this table because pandemic-period figures are not directly comparable to normal years and the NBS series does not present them on the same basis. The 2024 and 2025 growth rates are calculated within the NBS series.
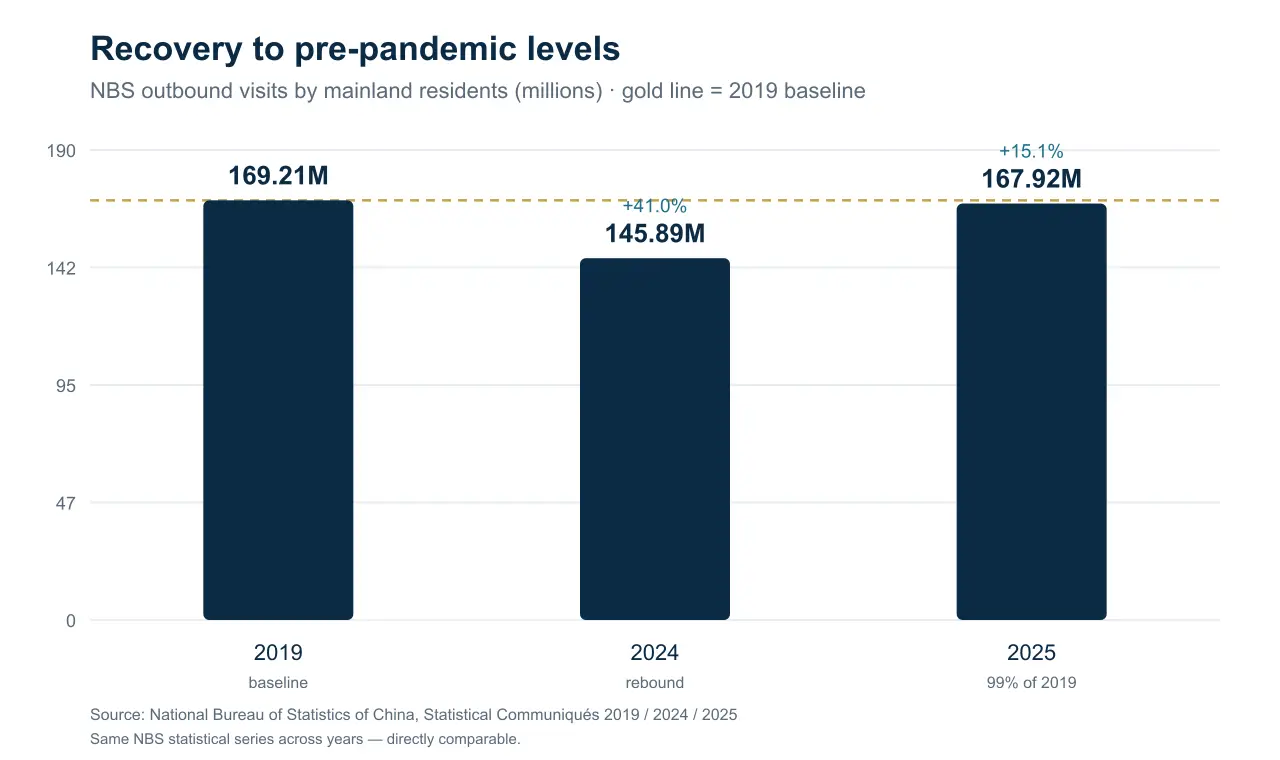
Figure: NBS outbound visits, 2019 vs 2024 vs 2025 — the most directly comparable official series. Source: National Bureau of Statistics of China.
4.2 MCT Outbound Tourism Trips
China's Ministry of Culture and Tourism publishes outbound tourism trip data as part of its annual statistical bulletin:
| Year | Outbound Tourism Trips | YoY Growth | Source |
|---|---|---|---|
| 2025 | 148.36 million | +20.8% | MCT 2025 Statistical Bulletin |
Source: MCT 2025 Statistical Bulletin: zwgk.mct.gov.cn/zfxxgkml/tjxx/202606/t20260602_966073.html
The MCT 2025 figure of 148.36 million outbound tourism trips, with 20.8% year-over-year growth, comes directly from the MCT 2025 Statistical Bulletin. A comparable 2024 MCT figure using the same methodology is not included here, as the 2024 and 2025 MCT data should be verified for comparability before being used to calculate growth. The 20.8% growth rate is as published by MCT.
4.3 2026 Quarterly Data (NIA Border Crossings)
The National Immigration Administration publishes quarterly outbound border-crossing data for mainland residents. These figures provide the most timely indicator of outbound travel trends but measure border exits, not tourism trips:
| Period | Outbound Border Crossings | YoY Growth | Source | Status |
|---|---|---|---|---|
| H1 2026 (Jan–Jun) | 88.023 million | +10.5% | NIA, Oct 2026 release | Official actual (partial year) |
| Q3 2026 (Jul–Sep) | 48.508 million | +7.5% | NIA, Oct 20, 2026 release | Official actual (quarterly) |
| Jan–Sep 2026 (calculated) | ~136.5 million | N/A (no comparable baseline provided) | NIA figures summed by author | Author-calculated total |
Source: NIA: en.nia.gov.cn. Q3 2026 data released October 20, 2026. Jan–Sep total is an author-calculated sum of H1 and Q3 figures and is not a separately published NIA statistic. No year-over-year growth rate is provided for Jan–Sep because a directly comparable 2025 baseline from the same NIA series is not readily available.
4.4 2026 Full-Year Industry Forecast
China Trading Desk (CTD) published an updated full-year 2026 forecast on August 19, 2026, projecting:
- Total outbound trips: approximately 179.3 million
- Destination spending: approximately US$257.6 billion
These are industry forecasts published by China Trading Desk on August 19, 2026, not official government statistics. They are based on CTD's own estimation model and should not be described as confirmed results or compared directly with MCT official tourism trips. Forecasts are subject to revision as more data becomes available.
Source: China Trading Desk, "China Outbound Travel Set for Record Trip Volume in 2026," August 19, 2026: www.chinatradingdesk.com/post/china-outbound-travel-set-for-record-trip-volume-in-2026
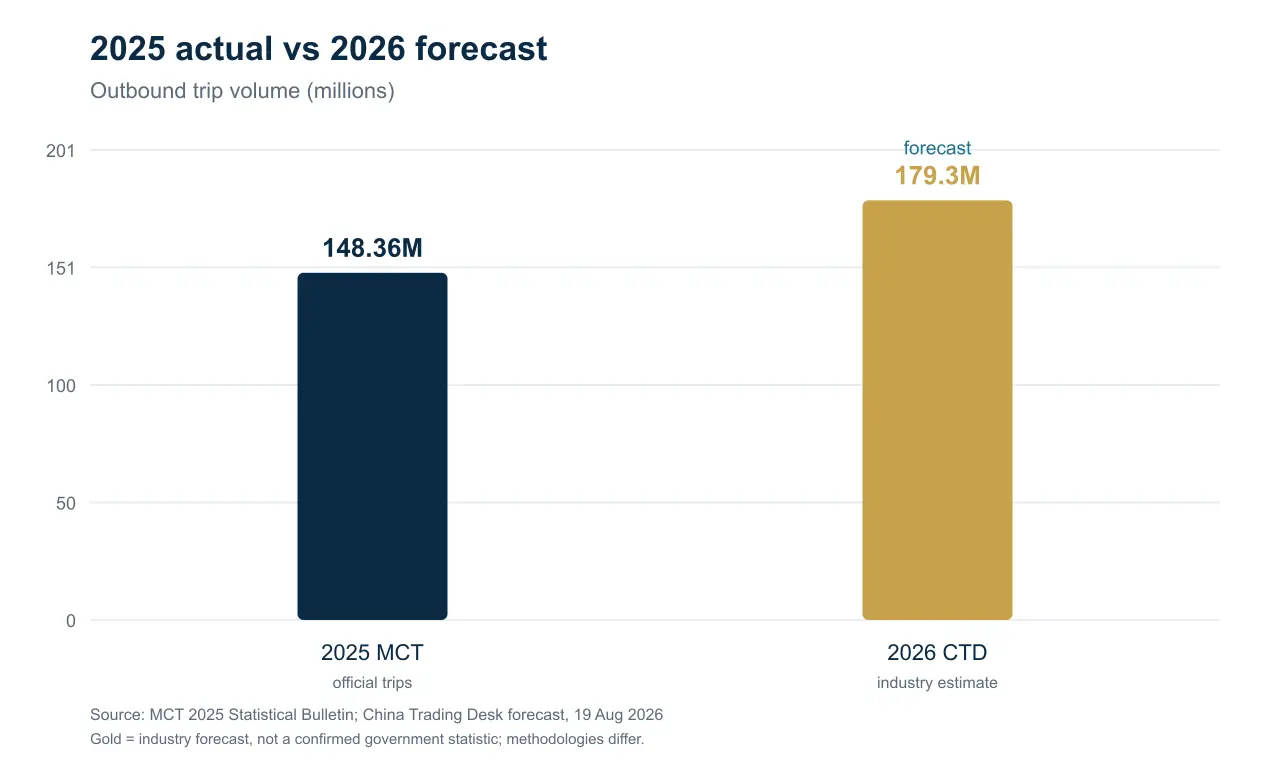
Figure: 2025 official trips vs the 2026 industry forecast. The gold bar is an estimate, not a confirmed government statistic.
5. Recovery: 2019 vs. 2025 vs. 2026
Assessing whether China's outbound tourism has "recovered" to pre-pandemic levels requires careful attention to which data series is used. Different indicators tell different stories.
5.1 Recovery by Comparable Data Series
| Indicator | 2019 Baseline | 2025 (Actual) | 2026 Status | Recovery vs. 2019 | Source |
|---|---|---|---|---|---|
| NBS outbound visits | 169.21 million | 167.92 million | On track to approach 2019 | 2025: 99.2% of 2019 (NBS series) | NBS 2019, 2025 communiqués |
| MCT outbound tourism trips | N/A (different series) | 148.36 million | N/A | Cannot directly compare to 2019 NBS | MCT 2025 bulletin |
| NIA border crossings | Different concept | Growing strongly | Above 2019 by some measures | Different statistical concept | NIA quarterly releases |
| Travel service imports (BOP) | US$254.6 billion (estimated) | US$253.78 billion | N/A | Nearly identical in nominal USD; comparability of 2019 estimate not verified | SAFE / Xinhua (2025); 2019 is industry estimate |
| Destination spending (CTD) | Pre-pandemic baseline | Growing | Forecast US$257.6B (2026) | Forecast suggests above 2019; depends on methodology | CTD Aug 2026 forecast |
Whether the market has "fully recovered" depends on the metric chosen. By NBS outbound visits (the most directly comparable official series), 2025 was at 99.2% of 2019. By travel service imports, spending was close to 2019 in nominal USD, though the 2019 baseline is an estimate and full comparability has not been verified. Even where volumes have recovered, the structure of the market has changed.
5.2 Structural Shifts Since 2019
Even where volumes approach 2019 levels, the structure of China's outbound tourism market has changed. Industry observers and the China Tourism Academy have noted several broad shifts in the market. The following trends are based on industry reports and observation, and quantitative comparisons with 2019 are limited by differences in data collection across the pre-pandemic and post-pandemic periods.
- Destination mix: The ranking of top destinations has shifted significantly since 2019, influenced by visa policies, safety perceptions, and geopolitical factors. Some destinations have surpassed 2019 visitor levels; others remain well below. (See Section 8 for destination-specific data from national tourism boards.)
- Traveler demographics: Industry surveys from OTA platforms (e.g., Fliggy, Qunar, iResearch) consistently indicate that younger travelers make up a large share of outbound travelers and that lower-tier cities are growing faster than tier-1 cities. Direct comparability with 2019 demographic data is limited because survey methodologies and platforms have evolved. (See Section 11 for details.)
- Booking behavior: Mobile booking, social media discovery, and AI-assisted planning are significantly more prevalent than in 2019, according to multiple industry reports. The EternityX 2026 report found 61.8% of surveyed travelers using AI for trip planning — a category that barely existed in 2019. (See Section 12 for details.)
- Trip patterns: Industry reports suggest longer trips, multi-destination itineraries, and a stronger focus on experiences relative to shopping compared with pre-pandemic patterns. The EternityX Golden Week 2026 report noted that 42% of package travelers took trips of 8+ days in 2026, up from 29% in 2024, and multi-destination bookings increased 84% year over year. (These are Golden Week package-tour figures and may not represent all outbound travel.)
These structural shifts are based on industry observation and various reports. Quantitative comparisons with 2019 are limited by differences in data collection and definitions across the pre-pandemic and post-pandemic periods. See Sections 8, 11, and 12 for sources on specific trends.
6. Outbound Travel Spending
Chinese outbound travel spending is among the most closely watched metrics in global tourism. However, spending figures are particularly susceptible to confusion because different sources measure different things. This section focuses on what can be reliably established from available data.
6.1 Travel Service Imports (SAFE Balance of Payments)
The most comprehensive official measure of Chinese outbound travel-related spending comes from SAFE's balance of payments statistics. SAFE reports travel services debits — the amount China spends on travel services imported from abroad.
| Year | Travel Service Imports (BOP) | YoY Change | Data Status | Source | Note |
|---|---|---|---|---|---|
| 2019 | US$254.6 billion | N/A | Industry estimate (pre-pandemic baseline) | Derived from SAFE data / industry reports | Estimated pre-pandemic baseline; exact figure not independently verified for this article |
| 2025 | US$253.78 billion | +1.1% | Official actual (BOP) | SAFE balance of payments data (as reported by Xinhua) | SAFE BOP travel category; comparable to BOP data from other countries |
Important: Travel service imports is a balance-of-payments (BOP) measure, not a "Chinese tourist spending" figure. It includes all travel-related service imports: tourism spending, business travel expenses, education-related travel, medical travel costs, and payments to foreign service providers at the destination. It does NOT include international passenger air fares — those are classified under "transport services" in the BOP, not "travel services." This is why BOP travel spending can differ significantly from "total outbound tourism spending" estimates that include airfare.
Source: SAFE balance of payments statistics, www.safe.gov.cn. 2025 figure cited in industry analysis based on SAFE BOP data and reported by Xinhua. 2019 figure is a commonly cited industry estimate derived from SAFE data. Readers should verify both figures against the original SAFE BOP statistical tables for full confidence.
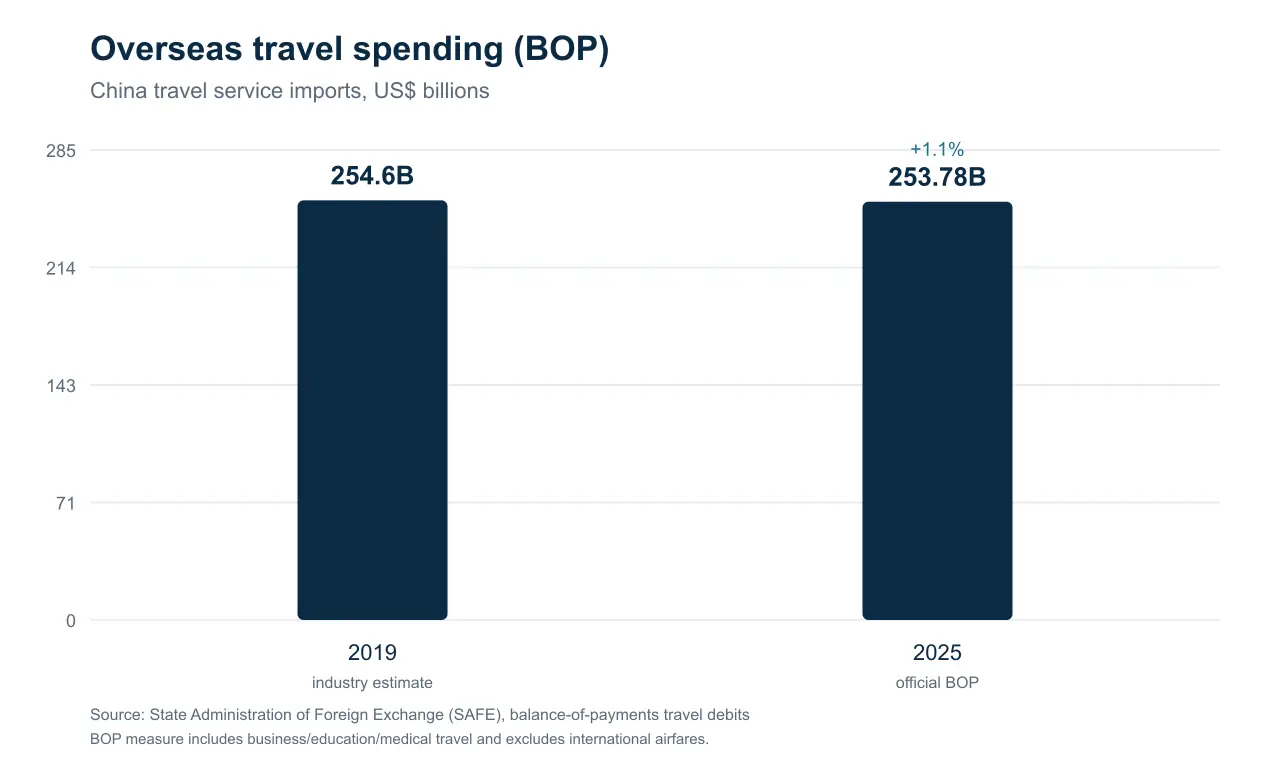
Figure: Overseas travel spending as measured in the balance of payments. Source: State Administration of Foreign Exchange (SAFE).
6.2 Destination Spending (Industry Estimates)
Industry research firms also publish estimates of "destination spending" — the amount Chinese travelers spend at their overseas destinations. China Trading Desk forecast US$257.6 billion in destination spending for full-year 2026 in its August 19, 2026 update.
This is an industry forecast, not a confirmed result, and uses a different methodology from SAFE's BOP travel service imports. The two figures should not be presented as directly comparable.
Source: China Trading Desk, August 19, 2026 forecast: www.chinatradingdesk.com/post/china-outbound-travel-set-for-record-trip-volume-in-2026
6.3 Per-Trip Spending
A reliable, widely accepted figure for average per-trip spending by Chinese outbound tourists is difficult to establish because:
- Total spending figures use different definitions (BOP vs. destination spending)
- Trip count figures use different definitions (tourism trips, visits, border crossings)
- Per-trip spending varies enormously by destination, trip length, travel purpose, and traveler segment
- Survey-based per-trip spending figures may have sample bias and often focus on specific segments (e.g., luxury travelers, OTA users)
Because of these definitional differences, readers should be cautious about derived figures such as "average spending per trip" when the numerator (spending) and denominator (trips) come from different sources using different measurement concepts. This article does not present a single "average per-trip spend" figure as a confirmed statistic.
7. Where Outbound Travel Spending Goes
A detailed, verified breakdown of Chinese outbound travel spending by expenditure category (accommodation, food, shopping, local transport, attractions) is not available from official Chinese government statistics. Industry reports provide some insight but use different methodologies and sample groups.
7.1 What Official Data Tells Us
SAFE's balance of payments data categorizes travel into personal travel and business travel, but does not provide a tourism-specific spending breakdown by expenditure type in publicly available data. The personal travel category itself includes health, education, and other purposes alongside leisure tourism.
7.2 Industry Research on Spending Patterns
Various industry reports and consumer surveys offer insights into how Chinese travelers allocate their spending. However, these findings should be treated as indicative rather than definitive, and percentages can vary significantly across studies depending on methodology and sample.
Based on multiple industry sources, the broad patterns commonly described include:
- Accommodation: Typically one of the largest spending categories for international travel. Chinese travelers' accommodation spending varies significantly by destination and traveler segment.
- Food and beverage: A major category. Food tourism is growing in importance as a motivation for travel among Chinese visitors.
- Shopping: Historically a very large category for Chinese outbound travelers, particularly in duty-free destinations. Industry observers suggest its share of total spending may have declined relative to pre-pandemic years, though reliable comparative data is limited.
- Local transport: Includes domestic flights, trains, taxis, ride-hailing, and car rentals at the destination.
- Attractions and experiences: Generally described as growing in importance as travel motivation shifts toward experiences.
Readers seeking precise spending-by-category percentages should consult original research reports and examine their methodology carefully. Because different studies define categories differently and survey different populations, published percentages are not always comparable. This article does not present a single definitive spending breakdown table.
7.3 Duty-Free and Airport Retail
Duty-free shopping has historically been an important component of Chinese outbound travel spending, particularly in Northeast Asian destinations. Key observations from industry reports include:
- South Korea's duty-free market is the largest single market for Chinese duty-free spending
- Some duty-free operators have reported rising Chinese customer numbers alongside changes in per-person spending patterns
- Hainan's offshore duty-free program provides a domestic alternative that may have diverted some spending from overseas trips
Specific duty-free spending figures should be sourced from the relevant national tourism board or duty-free operator, as they vary significantly by market and are not consolidated at the China national level in official statistics.
8. Top Destinations
The popularity of destinations among Chinese travelers has been dynamic in the post-pandemic period, influenced by visa policy changes, flight capacity, safety perceptions, geopolitical factors, and social media trends. Different data sources show somewhat different rankings depending on what is being measured.
8.1 What Different Data Sources Show
| Data Source | What It Measures | Key Strengths | Limitations |
|---|---|---|---|
| National tourism boards (JNTO, KTO, TAT, etc.) | Official visitor arrivals by nationality | Authoritative; consistent methodology over time | Measures arrivals, not trips from China; includes non-tourism visits |
| NIA border crossing data | Mainland resident exits by destination country/region | Timely; official government data | Measures border exits, not tourism purpose |
| OTA booking data (Trip.com, Ctrip, etc.) | Hotel/flight/tour bookings on the platform | Granular; reflects actual bookings | Reflects platform user base only; may not represent all travelers |
| Consumer surveys | Travel intentions and preferences | Insights into motivation and planning | Intentions may not match actual bookings; sample bias |
Short-haul Asia led the post-pandemic recovery: Japan was the single largest foreign destination (about 9.1 million Chinese visitors in 2025, roughly 95% of its 2019 level), followed by South Korea, Thailand, Malaysia, Singapore and Vietnam, while long-haul Europe, North America and Oceania grew faster in percentage terms from smaller bases. Because any destination ranking depends entirely on which source and definition you use (table above), we keep the detailed, regularly updated country-by-country analysis in a dedicated companion piece.
For full destination rankings, emerging markets, seasonality and spending by destination, see our Where Are Chinese Tourists Traveling in 2027 guide.
8.5 Hong Kong, Macau, and Taiwan
Trips to Hong Kong, Macau, and Taiwan account for a large share of mainland residents' outbound visits in NBS statistics (112.71 million of 167.92 million total outbound visits in 2025, or 67.1%, per NBS 2025 Statistical Communiqué). Their inclusion in "outbound" statistics is one reason NBS outbound visit figures differ from MCT tourism trip figures — many short-haul visits to Hong Kong and Macau may fall outside MCT's tourism trip definition.
Source: NBS 2025 Statistical Communiqué: www.stats.gov.cn/english/PressRelease/202602/t20260228_1962661.html
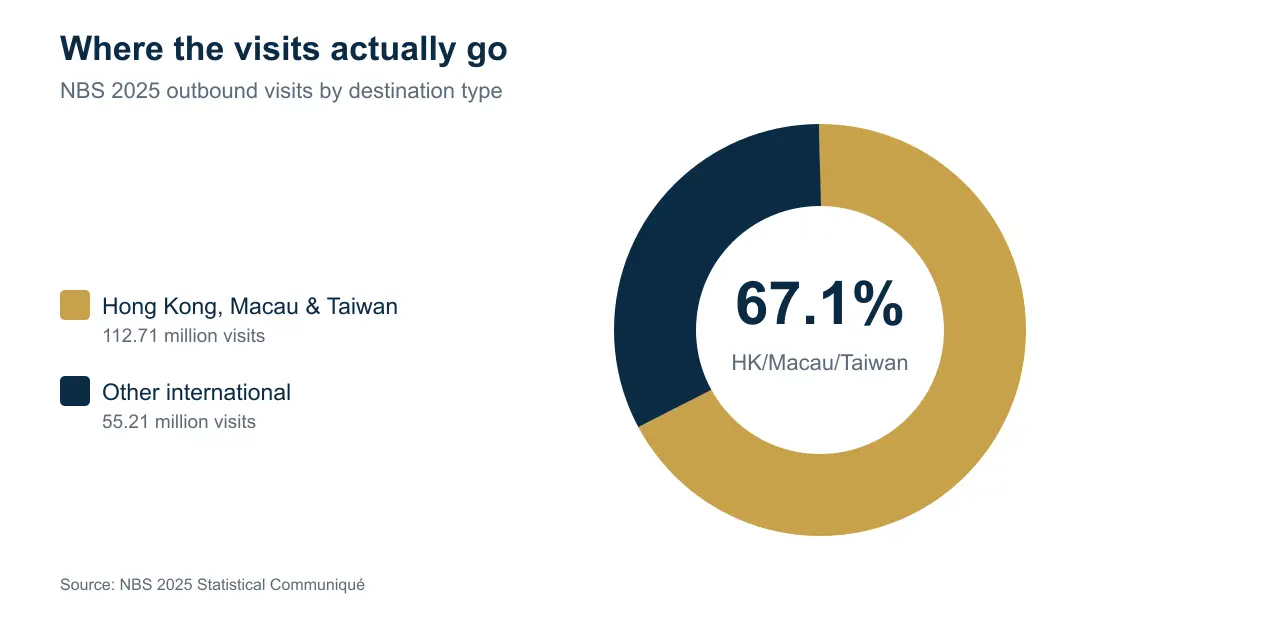
Figure: Where the visits actually go — two thirds of all 2025 outbound visits were to Hong Kong, Macau and Taiwan. Source: NBS 2025 Statistical Communiqué.
9. Major Outbound Source Markets in China
Understanding where Chinese outbound travelers come from is important for airlines, destinations, and tourism marketers. However, official city-level outbound travel data is not comprehensively published in a comparable format. Most city-level insights come from OTA booking data or airport traffic statistics, which reflect specific aspects of travel rather than total outbound tourism volume.
9.1 Key Cities
Based on multiple indicators (international airport traffic, OTA booking data, general economic and demographic factors), the following cities are widely recognized as major outbound travel markets in China. They are listed alphabetically, not by rank, as no single authoritative source provides a verified, comparable city ranking by total outbound tourism trips:
| City | Region | Why It Is a Major Outbound Market | Supporting Indicators |
|---|---|---|---|
| Beijing | North China | National capital; center of government, business, education, and culture | Major international aviation hub (Capital and Daxing airports); large business and diplomatic travel volume |
| Chengdu | Southwest China | Primary hub for western China; growing middle class | Major inland international airport (Tianfu); recognized as a key western China outbound gateway |
| Guangzhou | South China | South China's primary aviation and trade hub; proximity to HK/Macau | Baiyun Airport is one of China's busiest international airports; Guangdong has the largest provincial economy |
| Hangzhou | East China | E-commerce and tech hub; high income levels in Zhejiang province | Growing international flight network; strong outbound demand indicated by OTA data |
| Shanghai | East China | China's financial and commercial center; highest per-capita income among major cities | Pudong and Hongqiao airports handle the most international traffic in mainland China; consistently top source city in OTA data |
| Shenzhen | South China | Tech and innovation hub; young, affluent population; adjacent to Hong Kong | Fast-growing international flight capacity; strong outbound growth in OTA booking data |
No single authoritative source provides a verified, comparable ranking of Chinese cities by outbound tourism trip volume. The above list identifies broadly recognized major markets based on multiple indicators. Different sources may rank cities differently depending on what they measure (flight bookings, tour bookings, total departures, etc.).
9.2 Lower-Tier City Growth
OTA industry reports consistently note that outbound travel from tier-3 and lower-tier cities is growing faster than from tier-1 cities, though from a lower base. This is an important structural trend driven by rising incomes, expanding airport connectivity, and increasing passport penetration in smaller cities.
Specific growth rates and market share figures for lower-tier cities are typically based on individual platform data and may not represent the overall market. The broader trend of growing outbound demand from lower-tier cities is, however, widely recognized by industry observers.
9.3 Why Source-Market Data Matters
Understanding which Chinese cities generate the most outbound travelers is important for:
- Airlines: route planning and capacity decisions
- Destinations and NTOs: targeting marketing resources and developing city-specific strategies
- Hotels and tour operators: product development and customer segmentation
- Travel retailers and service providers: Chinese-language services, payment infrastructure, and marketing priorities
10. Visa Policy and Its Impact
Visa policy is one of the most important factors influencing Chinese outbound travel patterns. The expansion of visa-free access for Chinese citizens has been a major driver of growth in recent years. However, visa rules are complex and vary by country, purpose of travel, duration, passport type, and entry port.
10.1 Types of Visa Arrangements
| Visa Type | Description | Examples (illustrative, verify before travel) | Notes |
|---|---|---|---|
| Mutual visa exemption | Both countries agree to visa-free entry for each other's citizens, for specified purposes and durations | Singapore (30 days, since Feb 2024), UAE, Thailand, Serbia, San Marino | Applies to ordinary passports for tourism/business; check specific conditions and duration with the destination embassy |
| Unilateral visa-free entry | Destination country allows Chinese passport holders entry without a visa, on a unilateral basis | Maldives, Fiji, Mauritius, Qatar | Number of such destinations has expanded; conditions on length of stay and purpose apply; subject to change by the destination country |
| Visa on arrival (VOA) | Visa issued at the port of entry upon arrival | Indonesia (selected ports), Cambodia, Laos, Egypt | May have fees, documentation requirements, and entry-port restrictions; not available at all ports |
| Electronic visa (e-visa) | Visa applied for and issued electronically before travel | Vietnam, India, Turkey, Australia (online visitor visa) | Convenient alternative to consular visas; processing times and requirements vary by country |
| Conditional / regional visa-free | Visa-free access only for specific regions or travelers meeting conditions | South Korea (Jeju Island visa-free; group tour conditions for mainland China) | Not valid for the entire country; eligibility depends on port of entry, group status, and purpose |
Visa rules change frequently and depend on nationality, passport type, purpose of travel, duration of stay, and entry port. Travelers should always verify current entry requirements with the destination country's embassy or official immigration website before planning travel. The examples above are illustrative and may not reflect the latest changes.
10.2 The Expansion of Visa-Free Access
The number of countries and territories offering some form of visa-free or visa-on-arrival access to Chinese passport holders has expanded significantly in the post-pandemic period, as countries compete to attract Chinese tourists. Notable developments include:
- Thailand's visa-free policy for Chinese tourists, first introduced in September 2023 and extended multiple times since
- Malaysia's introduction of visa-free entry for Chinese tourists
- China-Singapore reciprocal 30-day visa-free arrangement (effective February 9, 2024)
- Vietnam's expansion of e-visa availability and unilateral visa waivers for certain groups
10.3 How Visa Policy Affects Travel Patterns
Visa policy has a clear impact on Chinese visitor numbers to a destination. When a major destination introduces visa-free access for Chinese tourists, the immediate effect is typically a significant increase in Chinese visitor arrivals. This is because:
- Visa applications require time and planning — removing this barrier makes spontaneous and short-notice travel possible
- Visa fees add to the cost of travel — visa-free access improves price competitiveness
- Visa-free announcements generate media coverage and social media discussion, increasing traveler awareness and interest
Visa-free policy is one of the fastest-acting policy levers for boosting Chinese visitor arrivals. Destinations that have introduced visa-free access for Chinese tourists in recent years have generally seen significant growth in the months following implementation.
Visa policy runs in both directions. The same wave of liberalisation that sent more Chinese travellers abroad also reopened China to the world: since late 2023 China has progressively expanded its own visa-free entry and transit arrangements for inbound visitors. For the current rules — how long you can stay, which ports are covered and how to route a stopover — see our China transit visa and visa-free guide.
11. Traveler Demographics
Demographic data on Chinese outbound travelers comes primarily from industry surveys and OTA platform data, rather than from official government statistics. As such, demographic figures reflect the survey or platform sample and may not be representative of all Chinese outbound travelers.
11.1 Age Distribution
Industry research generally indicates that Chinese outbound travelers skew young. Key findings from various industry sources include:
- Young travelers (broadly defined as 18-35 years old) make up a significant share of outbound travelers, according to multiple industry surveys and OTA platform reports
- Gen Z travelers (born roughly 1995-2005) are a fast-growing age segment in outbound travel, according to Fliggy and other OTA data reports
- Older travelers (55+) are also a growing segment, sometimes referred to as "silver travelers," particularly for off-peak and group travel
Specific age-group percentages vary across surveys depending on the platform, sample frame, and definition of "outbound traveler." No authoritative, government-published demographic breakdown of all Chinese outbound travelers exists. The qualitative trend — younger travelers making up a large and growing share — is consistent across multiple industry sources.
11.2 Income and Socioeconomic Profile
Outbound travel in China is concentrated among middle- and upper-income urban groups, particularly in tier-1 and tier-2 cities. However, the socioeconomic base is broadening as incomes rise in lower-tier cities.
- Core outbound travelers: Urban, middle-class or above, with sufficient disposable income for international travel
- High-net-worth segment: A smaller but high-spending segment that takes more frequent and longer trips, often to long-haul and luxury destinations
- Emerging middle class: Travelers from tier-2 and tier-3 cities who are beginning to travel internationally, often starting with short-haul Asian destinations
Specific income distribution figures for outbound travelers come from OTA user surveys and may not be representative of the broader outbound travel population. Income statistics should be interpreted in the context of the survey methodology and sample frame.
12. How Chinese Travelers Plan and Book Overseas Trips
The way Chinese travelers research, plan, and book international travel has evolved significantly in recent years, driven by the growth of mobile internet, social media, short-video platforms, and AI tools. Most of our understanding of these trends comes from industry reports and platform data.
12.1 Online Travel Agencies (OTAs)
Major Chinese OTAs remain the primary booking channel for outbound travel:
| Platform | Group / Type | Characteristics |
|---|---|---|
| Trip.com / Ctrip (Trip.com Group) | Largest OTA | Broadest international inventory; strong in business travel via Trip.Biz; international brand (Trip.com) |
| Fliggy (Alibaba Group) | OTA / lifestyle platform | Integrated with Alipay and Taobao; strong in content-driven commerce |
| Qunar (Trip.com Group) | Budget-focused OTA | Strong in price comparison and budget travel |
| Tongcheng (Ly.com) | Lower-tier city focus | WeChat mini-program integration; strong domestic base with growing outbound |
12.2 Social Media and Content Discovery
Social media platforms have become increasingly important for travel inspiration and discovery among Chinese travelers. Key platforms include:
- Xiaohongshu (Little Red Book): A major platform for travel content, reviews, and recommendations. Travel content has grown significantly on the platform.
- Douyin (TikTok China): Short-video platform with growing travel content. Video content influences destination popularity, with some "viral" destinations seeing rapid surges in interest.
- WeChat: China's dominant messaging and social platform. Travel companies use WeChat Official Accounts and mini-programs to reach customers and enable bookings.
Industry reports suggest that content platforms play an important role in travel discovery, complementing direct search on OTAs. However, specific market-share percentages vary by study and depend on the question asked and the sample group.
12.3 AI-Assisted Travel Planning
AI tools are an emerging trend in Chinese travel planning. The EternityX Golden Week 2026 Chinese Outbound Travel Insights Report, published in October 2026, surveyed Chinese consumers about their travel planning habits. The report found that 61.8% of surveyed Chinese travelers reported using AI tools to help plan itineraries, while 20.3% said they were willing to book travel through AI services. The report also noted that AI-guided bookings on OTA platforms had grown rapidly month over month.
These figures come from a consumer survey conducted by EternityX and reflect the specific sample and methodology of that report. AI adoption rates may vary across age groups, income levels, travel experience, and the specific type of AI tool measured. As AI tools improve and become more integrated into booking platforms, their role in travel planning is expected to grow.
Source: EternityX, "Golden Week 2026 Chinese Outbound Travel Insights Report," October 2026. Survey-based findings; sample details available in the full report.
12.4 Independent Travel and Group Tours
Independent travel (free independent travel, or FIT) is the dominant mode for Chinese outbound travelers, accounting for a large majority of trips, according to industry estimates. Group tours remain important for certain segments, including:
- First-time international travelers
- Older travelers and senior groups
- Family groups with children
- Long-haul destinations where language and logistics barriers are higher
Other growing modes include customized/private tours, self-drive tours (popular in some destinations), and themed tours focused on food, photography, or outdoor activities.
The exact share of independent vs. group travel varies by source and definition. Different studies may categorize travel modes differently. The broad trend toward independent travel is widely recognized in the industry.
13. Travel Purpose
13.1 Leisure Travel
Leisure travel accounts for the majority of Chinese outbound tourism trips. Within leisure travel, key motivations commonly cited in industry research include:
- Sightseeing and cultural experiences
- Food and culinary tourism (a growing segment)
- Natural scenery and outdoor activities
- Theme parks and family entertainment
- Relaxation and beach holidays
- Shopping
Industry research has identified a broad trend from checklist-style sightseeing toward more experiential travel, with travelers seeking more immersive and in-depth experiences. This is consistent with observed growth in activity bookings and local experiences.
13.2 Business Travel
Business outbound travel from China has been growing strongly in the post-pandemic period. The Trip.Biz White Paper (published by Trip.com Group's business travel arm) reports that corporate outbound travel bookings have grown at approximately 30% annually for three consecutive years (2023-2025).
Key trends reported in business travel data include:
- Growth in SME (small and medium enterprise) business travel, with both trip numbers and booking values growing rapidly
- A shift in business travel destinations, with Southeast Asia, Central Asia, and the Middle East growing faster than traditional Western destinations
- Manufacturing, tech/R&D, and financial services as the largest sectors for business travel
Source: Trip.Biz White Paper, Trip.com Group. Reported in industry coverage of China Daily Global, April 2026: chinadailyglobal.com/a/202604/25/WS69ec0a40a310d6866eb457b2.html
Business travel statistics from corporate travel platforms may not capture all business travel, including travel booked through consumer channels or arranged directly by companies.
13.3 Other Travel Purposes
- Visiting friends and relatives (VFR): A significant category, particularly for destinations with large Chinese diaspora communities. Difficult to separately quantify in official statistics.
- Education-related travel: Includes campus visits, study tours, and visits to children studying abroad. Particularly relevant for the US, UK, Australia, and Canada.
- Medical and wellness travel: A growing niche segment, with popular destinations including South Korea, Japan, and Thailand.
14. China in Global Context
China is widely recognized as the world's largest outbound tourism market by spending. However, exact cross-national comparisons are complicated by differences in measurement methodologies across national statistical systems.
14.1 Global Ranking
According to UN Tourism (the United Nations World Tourism Organization, formerly UNWTO), China has been the world's top spender on international tourism since the early 2010s. UN Tourism's annual World Tourism Barometer and statistical yearbooks track international tourism expenditure by source market.
Global international tourism expenditure was estimated at approximately US$1.5-1.6 trillion in 2025, according to UN Tourism estimates. China accounts for a significant share of this global total, though the exact share depends on which measure of Chinese spending is used and how other countries' figures are calculated.
Source: UN Tourism, World Tourism Barometer (various editions), www.unwto.org/tourism-data/world-tourism-barometer
14.2 Comparing Chinese Travelers to Other Nationalities
Chinese outbound travelers have several characteristics that distinguish them from travelers in other major markets, though these should be understood as broad generalizations rather than universal traits:
- Younger age profile: Industry surveys suggest Chinese outbound travelers skew younger than travelers from some mature markets, though this may change as the market matures
- Mobile-first booking: Chinese travelers are generally early adopters of mobile booking, social media discovery, and digital payment technologies
- Rapid growth trajectory: China's outbound tourism market has grown faster than most mature markets over the past two decades, reflecting rising incomes and increasing passport penetration
Cross-national comparisons of outbound tourism should be interpreted with caution. Different countries measure outbound travel and spending using different statistical methodologies. Per-capita figures can be misleading when comparing a large, diverse country like China with smaller, more affluent countries.
15. 2027 Outlook and Key Challenges
The outlook for China's outbound tourism market in 2027 is broadly positive, with continued growth expected. However, the rate and shape of growth will depend on several interrelated factors.
Important: This article does not present a single precise numerical forecast for 2027 outbound trips or spending. No major international research institution or official agency has published a detailed, sourced 2027 forecast with clear methodology at the time of writing. Instead, this section presents a structured qualitative discussion of the factors that will shape the market in 2027, based on established trends and available evidence.
15.1 Growth Drivers
International Flight Capacity and Connectivity
International flight capacity has been recovering since 2023 and is approaching pre-pandemic levels on many routes. Continued capacity expansion in 2027, particularly for long-haul routes, would support further growth in outbound travel. Key factors include airline fleet and route network decisions, bilateral air service agreement negotiations, and slot availability at major airports.
Visa Access and Entry Requirements
Visa policy has been one of the most significant drivers of Chinese outbound travel growth. If more countries introduce or expand visa-free access for Chinese citizens in 2027, this could stimulate additional growth. Conversely, visa restrictions or policy changes could dampen travel to specific destinations.
Household Spending and Travel Budgets
The overall trajectory of the Chinese economy and household disposable income will be a fundamental driver of outbound travel demand. If economic growth remains solid and consumer confidence holds, outbound travel should continue to grow. If economic conditions weaken, travel budgets could come under pressure.
Exchange Rates and Destination Costs
The exchange rate between the RMB and major destination currencies affects the cost of international travel for Chinese travelers. A stronger RMB makes overseas travel more affordable, while a weaker RMB increases costs. Inflation rates in destination countries also affect travel costs in local currency terms.
Regional Destination Demand
Different destination regions will likely grow at different rates in 2027:
- Short-haul Asia: Likely to remain the dominant regional market, with growth driven by increasing travel from lower-tier cities and expanding visa-free access.
- Long-haul destinations (Europe, North America, Oceania): Expected to continue recovering as flight capacity normalizes. Percentage growth may be higher than short-haul because it is measured against a lower base.
- Emerging destinations (Middle East, Central Asia, Africa, Latin America): Growing from a small base. Will remain a small share of total outbound trips for the foreseeable future.
15.2 Key Risks and Uncertainties
Geopolitical and Policy Uncertainty
Geopolitical factors remain a significant source of uncertainty. Changes in diplomatic relations, travel advisories, or visa policies can cause rapid and significant shifts in destination demand, as recent developments have demonstrated.
Economic Slowdown Risk
A significant economic slowdown in China could reduce discretionary spending on international travel. Travel is often one of the first categories of discretionary spending consumers cut back on during periods of economic uncertainty.
Health, Safety, and External Shocks
Public health events, natural disasters, or safety incidents in popular destinations could affect travel patterns. Consumer confidence in destination safety plays an important role in travel decisions.
Competition from Domestic Tourism
China's domestic tourism market is enormous and continues to grow rapidly, with improving infrastructure and a widening range of experiences. For many Chinese travelers, especially in lower-tier cities, domestic travel is the primary option, and international travel competes with domestic alternatives for leisure budget.
Flight Capacity and Air Connectivity
While international flight capacity has recovered significantly, it remains a constraint on some routes, particularly long-haul. Full recovery and expansion of flight capacity is essential for the continued growth of long-haul outbound travel. The pace depends on airline fleet decisions, bilateral air service agreements, and slot availability at major airports.
Changing Traveler Expectations
Chinese outbound travelers are becoming more experienced and sophisticated. Their expectations for service quality, authentic experiences, digital payment options, and Chinese-language services are rising. Destinations and businesses that fail to adapt to these changing expectations may find it increasingly difficult to attract and retain Chinese visitors.
15.3 Balanced Assessment
On balance, the outlook for China's outbound tourism market in 2027 is positive. The market is entering a phase of more normalized growth after the rapid post-reopening rebound. Growth will likely continue but at a more moderate pace than the 41% year-over-year growth seen in 2024. The key question is not whether growth will continue, but at what rate and with what distribution across destinations and traveler segments.
The most likely scenario for 2027 is continued moderate growth in outbound travel, supported by rising incomes, expanding visa-free access, and the normalization of international flight capacity. Growth rates will likely be lower than the post-pandemic rebound years, and there will be significant variation across destinations and traveler segments. Downside risks include geopolitical tensions, economic slowdown, and unexpected events that could disrupt travel patterns. This assessment is the author's analysis based on available evidence and is not a published forecast from any official agency or research institution.
17. Sources, Definitions and Methodology
17.1 Official Government Sources
| Agency | Full Name | What It Publishes | Source URL |
|---|---|---|---|
| MCT | Ministry of Culture and Tourism of the People's Republic of China | Annual cultural and tourism development statistical bulletin; outbound tourism trips | zwgk.mct.gov.cn/zfxxgkml/tjxx/202606/t20260602_966073.html |
| NBS | National Bureau of Statistics of China | Annual statistical communiqué on national economic and social development; outbound visits | 2024: www.stats.gov.cn/english/PressRelease/202502/t20250228_1958822.html | 2025: www.stats.gov.cn/english/PressRelease/202602/t20260228_1962661.html |
| NIA | National Immigration Administration | Border crossing statistics; quarterly and holiday outbound/inbound data | en.nia.gov.cn |
| SAFE | State Administration of Foreign Exchange | Balance of payments statistics; travel service imports/exports | www.safe.gov.cn |
| MFA | Ministry of Foreign Affairs | Visa policy announcements; travel advisories | www.fmprc.gov.cn/mfa_eng |
17.2 Industry and Research Sources
| Source | Type | Used For | Reference |
|---|---|---|---|
| China Trading Desk (CTD) | Industry research / advisory | 2026 full-year forecast (179.3M trips, US$257.6B destination spending) | "China Outbound Travel Set for Record Trip Volume in 2026," Aug 19, 2026 — www.chinatradingdesk.com/post/china-outbound-travel-set-for-record-trip-volume-in-2026 |
| EternityX | Marketing technology / research | Golden Week outbound insights; AI and social media travel trends | Golden Week 2026 Chinese Outbound Travel Insights Report, Oct 2026 |
| Trip.com Group | OTA group | Booking data; travel trend reports; Trip.Biz business travel data | Annual reports; quarterly earnings; trend reports; Trip.Biz White Paper |
| Fliggy (Alibaba) | OTA / platform | Booking trend data; demographic insights | Holiday period reports (Spring Festival, National Day, etc.) |
| Qunar | Budget OTA | Budget travel data; user demographics | Holiday reports; user surveys |
| China Tourism Academy | Official tourism research institute | Tourism research and market outlook | Research reports; conference presentations |
| iResearch (艾瑞咨询) | Market research | Traveler behavior and demographic surveys | Industry reports on travel and digital trends |
| UN Tourism (UNWTO) | UN agency | Global tourism statistics and trends | World Tourism Barometer — www.unwto.org/tourism-data/world-tourism-barometer |
| JNTO (Japan) | National tourism board | Chinese visitor arrivals to Japan | www.jnto.go.jp |
| KTO (South Korea) | National tourism board | Chinese visitor arrivals to South Korea | kto.visitkorea.or.kr |
| TAT (Thailand) | National tourism board | Chinese visitor arrivals to Thailand | www.tourismthailand.org |
| Tourism Malaysia | National tourism board | Chinese visitor arrivals to Malaysia | www.tourismmalaysia.gov.my |
| Singapore Tourism Board | National tourism board | Chinese visitor arrivals to Singapore | www.stb.gov.sg |
17.3 Methodology
This article synthesizes information from official government statistics, industry research reports, and publicly available data. Our approach follows these principles:
- Clear labeling: Every major statistic is labeled with its source, year, and data status (official actual, partial-year official, industry estimate, or forecast).
- No mixing of series: Year-over-year comparisons are made within the same statistical series whenever possible. Where different series are discussed together, the difference is explicitly noted.
- Transparency about limitations: Where reliable data is not available, we state the limitation rather than presenting unsupported estimates or guesses.
- Distinguishing facts from interpretation: Observed data points are clearly separated from analysis, opinion, and forecast.
- No invented data: We do not invent statistics, percentages, rankings, or survey results. If a figure cannot be verified, it is either removed or identified as unverified.
- Inline source attribution: Key statistics are accompanied by source references where they appear, so readers can trace each figure to its origin without relying solely on the end-of-article source list.
17.4 Last Updated
Last updated: October 28, 2026. All statistics and sources were reviewed against available data as of this date. Data for 2026 is partial-year or forecast unless otherwise noted. Readers should verify critical figures with primary sources before making business decisions.
17.5 Disclaimer
This article is for informational purposes only and does not constitute investment, business, or travel advice. All statistics are subject to revision as official agencies and research firms update their data. While every effort has been made to ensure accuracy, readers are encouraged to consult primary sources for the most current and authoritative information.
How to Cite This Article
If you use these figures in your own research, journalism, deck or blog, all we ask is that you credit Your Way Holiday and link back to this page so your readers can access the full methodology, definitions and primary sources.
Suggested citation:Your Way Holiday. (2026). China Outbound Tourism Statistics 2027: Key Data, Trends & Market Outlook. Your Way Holiday Travel Data. https://yourwayholiday.com/blog/china/china-outbound-tourism-statistics
Every chart on this page is original and free to reuse for non-commercial purposes with attribution and a link to the source URL above. For the exact statistical definition behind each number — and why figures from different agencies should never be mixed — see Section 17.
18. Final Thoughts
China's outbound tourism market has come a long way since borders reopened in 2023. By 2025, NBS outbound visits had nearly returned to 2019 levels at 99.2% of the pre-pandemic peak, and BOP travel spending was close to pre-pandemic levels in nominal terms. But the market that has emerged is fundamentally different from the one that existed in 2019.
The destination mix has shifted, the traveler demographic has broadened, and the booking journey runs through social media and AI tools as much as through traditional OTAs. Growth now comes from a wider base of cities and income groups across China.
The reopening cut both ways. Just as Chinese travellers returned to the world in record numbers, China threw its own doors open to inbound visitors — and the gateways most associated with that inbound revival are the same cities that anchor almost any first trip. Our guides to Beijing and Xi'an show how travellers are turning a single visa-free stopover into two cities on one itinerary.
China's outbound tourism market is not just recovering — it is transforming. Those who look beyond the headline numbers and understand the structural shifts will be best positioned to capture the opportunities as the market enters its next phase of growth. For the most current and authoritative data, readers should consult the primary sources cited throughout this article.
Last updated: October 28, 2026 | All statistics subject to revision | Consult primary sources before making business decisions










Traveler Discussions
Questions from travelers